Prometheus + Grafana 搭建监控系统
Prometheus + Grafana 搭建监控系统
前言
本文主要记录下如何使用 Prometheus + Grafana 搭建对各种服务的性能监控,涵盖对 Prometheus、Grafana 的基本介绍,以及如何使用二者进行对 Linux、MySQL、Redis等监控。为了方便操作,所有的组件都是基于 Docker 容器进行操作。
概述
Prometheus
概述
Prometheus 是云原生计算基金会的项目,是一个系统和服务监控系统。 它以给定的时间间隔从配置的目标收集指标,评估规则表达式,显示结果,并在观察到指定条件时触发警报。
Prometheus 与其他指标和监控系统的区别在于:
- 多维数据模型(由指标名称和键/值维度集定义的时间序列)
- 支持PromQL,一种强大且灵活的查询语言,可利用此维度
- 不依赖分布式存储,单个服务器节点是自治的
- 用于时间序列收集的 HTTP 拉取模型
- 通过用于批处理作业的中间网关支持推送时间序列
- 通过服务发现或静态配置发现目标
- 支持多种模式的图形和仪表板
- 支持分层和水平联合
架构图

安装
使用原生方式安装:下载地址
使用 Docker 安装
拉取镜像
docker pull prom/prometheus:v2.35.0启动命令
docker run --name prometheus -d -p 9090:9090 prom/prometheus:v2.35.0配置文件挂载
将容器内部的配置文件拷贝到宿主机
docker cp prometheus:/etc/prometheus /data/software/docker/prometheus/配置文件
prometheus.yml# my global config global: scrape_interval: 15s # Set the scrape interval to every 15 seconds. Default is every 1 minute. evaluation_interval: 15s # Evaluate rules every 15 seconds. The default is every 1 minute. # scrape_timeout is set to the global default (10s). # Alertmanager configuration alerting: alertmanagers: - static_configs: - targets: # - alertmanager:9093 # Load rules once and periodically evaluate them according to the global 'evaluation_interval'. rule_files: # - "first_rules.yml" # - "second_rules.yml" # A scrape configuration containing exactly one endpoint to scrape: # Here it's Prometheus itself. scrape_configs: # The job name is added as a label `job=<job_name>` to any timeseries scraped from this config. - job_name: "prometheus" # metrics_path defaults to '/metrics' # scheme defaults to 'http'. static_configs: - targets: ["localhost:9090"]
挂载配置文件启动容器
docker run --name prometheus -d -p 9090:9090 -v /data/software/docker/prometheus/conf:/etc/prometheus prom/prometheus:v2.35.0测试结果:
浏览器访问:http://ip:9090

Grafana
概述
Grafana 是一个可以监控,分析指标、日志,进行团队管理,提供漂亮仪表板的平台系统。无论数据存储在何处, 都可以进行查询、可视化、提醒。
安装
原生方式安装
Docker 安装
拉取镜像
docker pull grafana/grafana:7.5.16启动容器
docker run -d --name=grafana -p 3000:3000 grafana/grafana:7.5.16测试结果:
浏览器访问:http://ip:3000,成功访问如下页面

初始用户名:admin
初始密码:admin
配置 Prometheus 数据源
Grafana 展示 Promethus 监控需要配置对应的数据源,如下步骤进行配置:
新建数据源

选择 Prometheus

填写 Prometheus 地址(注意:要以 http 开头)

保存测试

应用
搭建 Linux 服务器性能监控
概述
使用 Node exporter 可以来收集 Linux 服务器相关的性能指标。
安装
拉取镜像
docker pull prom/node-exporter:v1.3.0启动容器
docker run --name node-export -p 9100:9100 -d prom/node-exporter:v1.3.0浏览器访问:http://ip:9100, 出现如下页面:

配置
Prometheus 配置文件
prometheus.yml添加配置- job_name: "linux" # metrics_path defaults to '/metrics' # scheme defaults to 'http'. static_configs: - targets: ["ip:9100"]重启 Prometheus 容器
docker restart prometheus进行测试,浏览器访问 http://ip:9090/service-discovery 出现如下页面:

展示
在 Grafana 中展示上述配置的 Node exporter, 一些漂亮的 DashBoard 模板可以在 插件中心 中下载
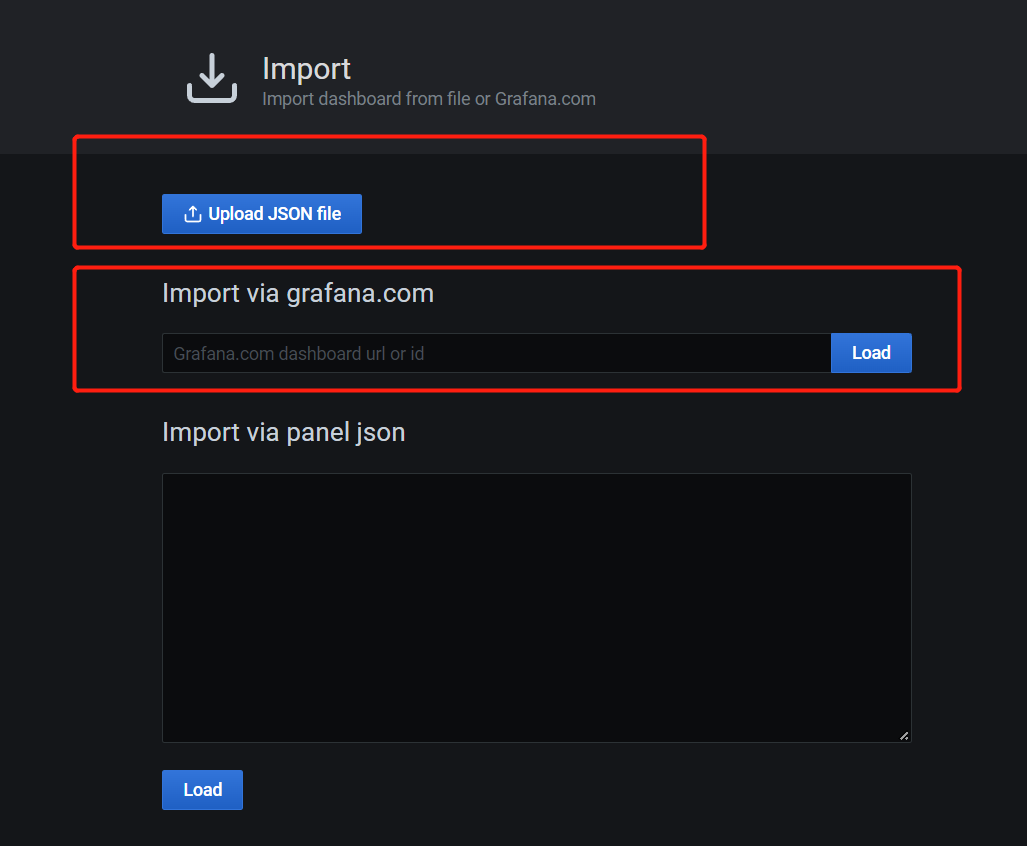
下载对应 dashboard 的 JSON 文件
在 Grafana 导入对应的 json 文件

也可以通过 url 或 id 进行导入
展示效果

搭建 MySQL 服务器性能监控
概述
使用 MySQLd exporter 可以来收集 MySQL 服务器相关的性能指标。
安装
拉取镜像
docker pull prom/mysqld-exporter:v0.13.0启动容器
docker run -d -p 9104:9104 --name mysql-exporter -e DATA_SOURCE_NAME="username:password@(ip:3306)/" prom/mysqld-exporter:v0.13.0测试,浏览器访问:http://ip:9104

配置
Prometheus 配置文件
prometheus.yml添加配置- job_name: "mysql" # metrics_path defaults to '/metrics' # scheme defaults to 'http'. static_configs: - targets: ["ip:9104"] labels: instance: mysql重启 Prometheus 容器
docker restart prometheus进行测试,浏览器访问 http://ip:9090/service-discovery 出现如下页面:

展示
在 Grafana 中展示上述配置的 MySQLd exporter, 一些漂亮的 DashBoard 模板可以在 插件中心 中下载
下载对应 dashboard 的 JSON 文件
在 Grafana 导入对应的 json 文件
也可以通过 url 或 id 进行导入
展示效果

搭建 Redis 服务器性能监控
概述
使用 Redis exporter 可以来收集 Redis 服务器相关的性能指标。
安装
拉取镜像
docker pull oliver006/redis_exporter:v1.37.0启动容器
docker run -d --name redis-exporter -p 9121:9121 oliver006/redis_exporter:v1.37.0 --redis.addr redis://ip:6379 --redis.password password测试,浏览器访问:http://ip:9121

配置
Prometheus 配置文件
prometheus.yml添加配置- job_name: "redis" # metrics_path defaults to '/metrics' # scheme defaults to 'http'. static_configs: - targets: ["ip:9121"] labels: instance: redis重启 Prometheus 容器
docker restart prometheus进行测试,浏览器访问 http://ip:9090/service-discovery 出现如下页面:

展示
在 Grafana 中展示上述配置的 Redis exporter, 一些漂亮的 DashBoard 模板可以在 插件中心 中下载
下载对应 dashboard 的 JSON 文件
在 Grafana 导入对应的 json 文件
也可以通过 url 或 id 进行导入
展示效果
